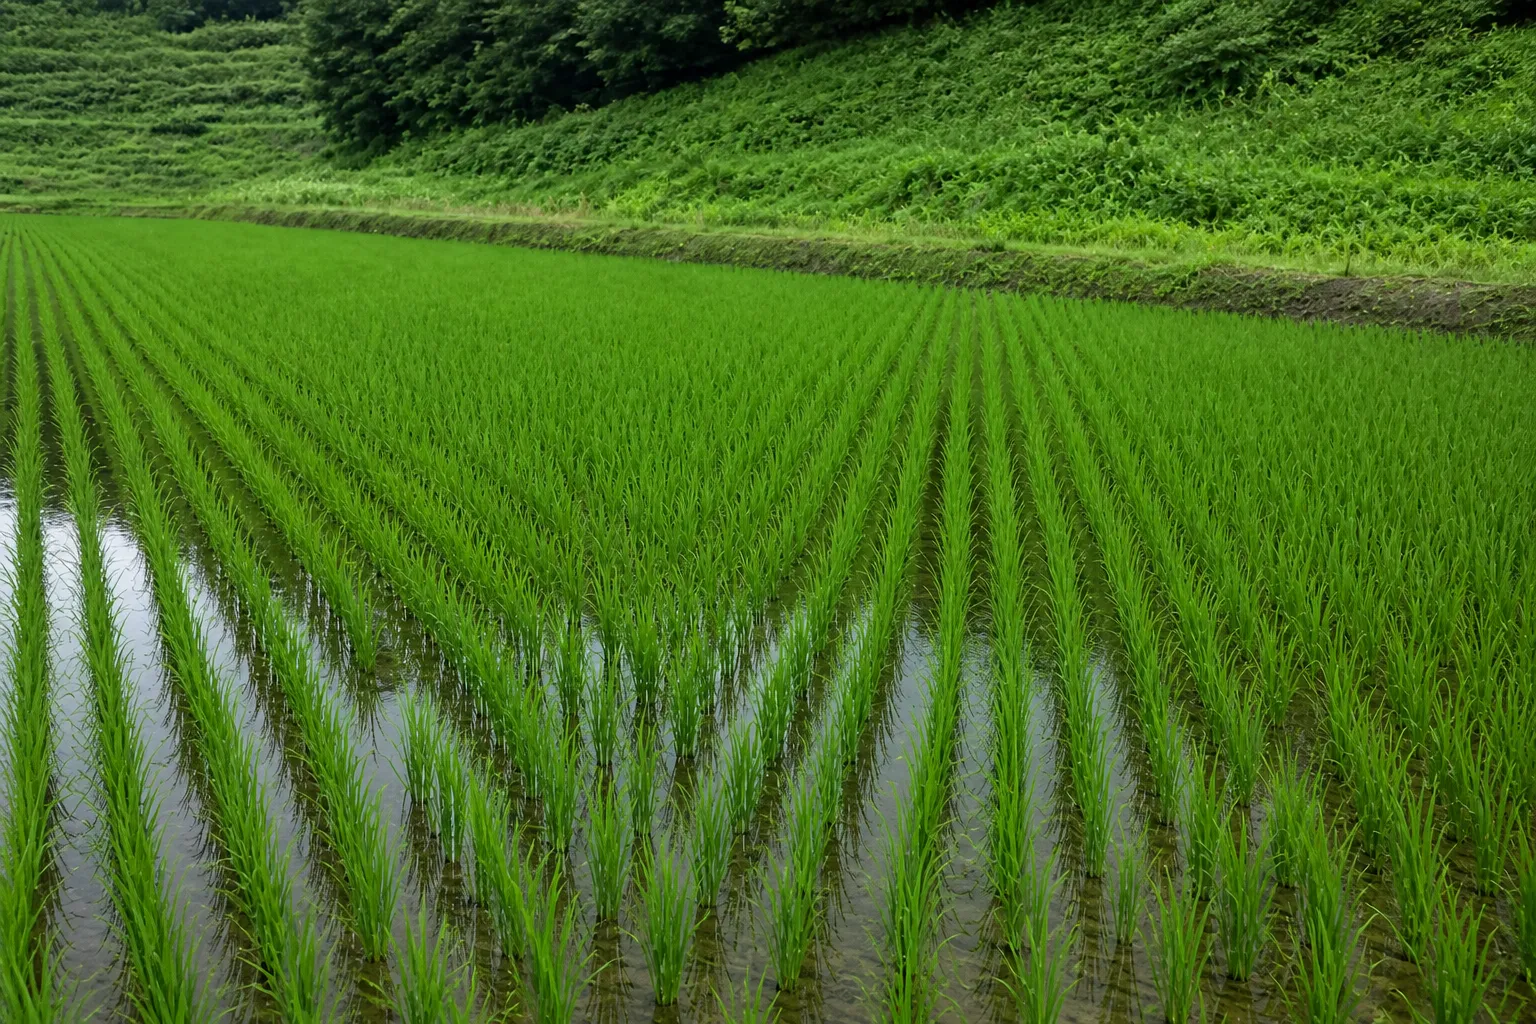
 BEFORE · AUG 27 · PRE-HEADING
S2 L2A Aug 27 → Sep 6 · S1 VV Sep 1 · 10 m · SCL 4+5
- ΔNDVI
- −0.21
- Loss share
- 35%
- Suspect
- 0.12ha
- Flooded
- 0.03ha
- Severe
- 0.05ha
- Minor
- 0.06ha
- Points
- 3+1
- Verdict
- Suspect
- EventTyphoon Sep 3 · Aug 27 ↔ Sep 6 compared
- FloodS1 VV below −18 dB · 3 dB drop, 0.03 ha
- DamageSouth 0.09 ha sharp loss · lodging suspected
- SurveyD1–D3 + control C1 · CSV/GeoJSON
- ReportDraft · confirmed by the assessor
Example screen
Find damaged fields from orbit, first.
TERRASENSE compares satellite images taken before and after a typhoon, heavy rain or drought, grades damage for every 10 m cell, picks the field survey points and carries it all through to a draft report for the certified loss assessor.
The problem
Disasters hit whole counties. Surveys go one field at a time.
One typhoon can touch every farm in a county, yet confirming the damage still starts with people visiting fields one by one.
Wide damage, few hands
Right after a disaster, the fields to check pile up at once. Nobody can visit them all on the same day.
Hard to know where to start
Working through claims in the order they arrive can mean the worst-hit fields are seen last.
Few common yardsticks
Even neighbouring fields can be hard to explain side by side. A before-and-after comparison on one standard makes it easier.
Three stages
Satellites find it, the field confirms it, a person decides.
TERRASENSE starts with wide-area satellite analysis and continues into a vision-AI field survey and a loss-assessment report. The certified assessor makes the final call.
Satellite wide-area analysis
Sentinel-2 and Sentinel-1 images before and after the event grade every 10 m cell and yield damage-suspect area and survey points.
Vision-AI field survey
Photos taken at the satellite-chosen points are read for lodging, flooding and fruit drop. Rolled out during the pilot.
Loss-assessment report
Satellite and field results are bundled into a draft report for the certified assessor, exported as PDF, CSV and GeoJSON.
TERRASENSE is a satellite first screening of suspected damage. It does not replace the crop-insurance loss assessment: the loss rate and indemnity are confirmed by a certified loss assessor in the field.
Features
One disaster, start to finish, on one screen.
Register fields, watch everyday growth, and when disaster strikes compare before and after through to survey points and a report.
Disaster damage analysis
NDVI loss, corrected with the crop growth curve, graded minor, moderate or severe, with damage-suspect area and loss share.
Radar flood detection
After heavy rain or a typhoon, Sentinel-1 radar finds flooded cells even under cloud.
Growth screening
Growth stage, NDVI and NDMI for paddy, upland and orchard flag water stress and growth lag early.
Field boundary detection
SAM2 splits the satellite photo into parcel candidates and shows each area in hectares.
Field survey points
Up to three worst-hit points and one healthy control, exported as CSV and GeoJSON.
Loss-assessment report
Damage map, area, loss share and survey points in a draft PDF report.
Live product
This is the service running today.
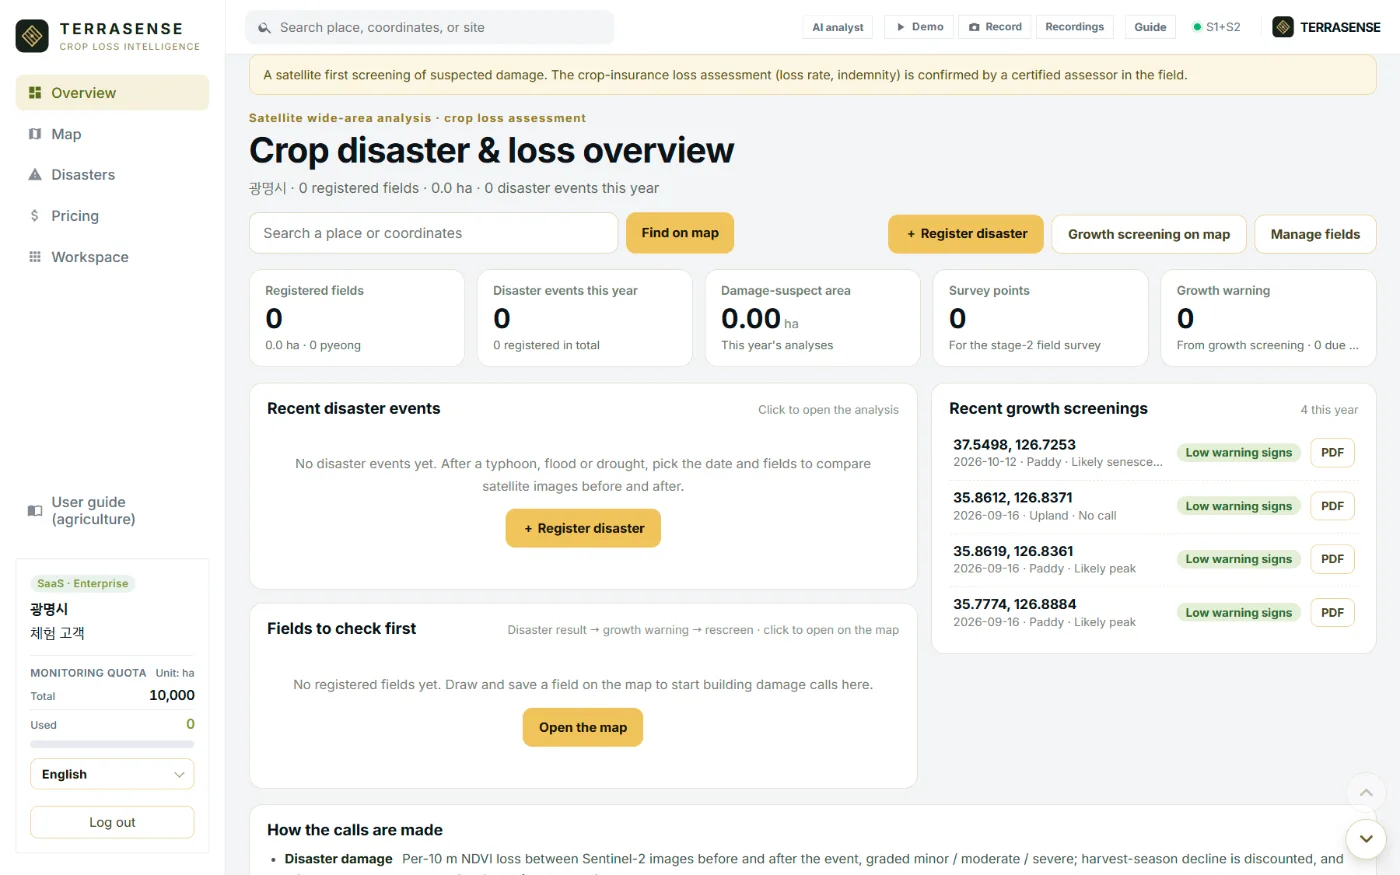
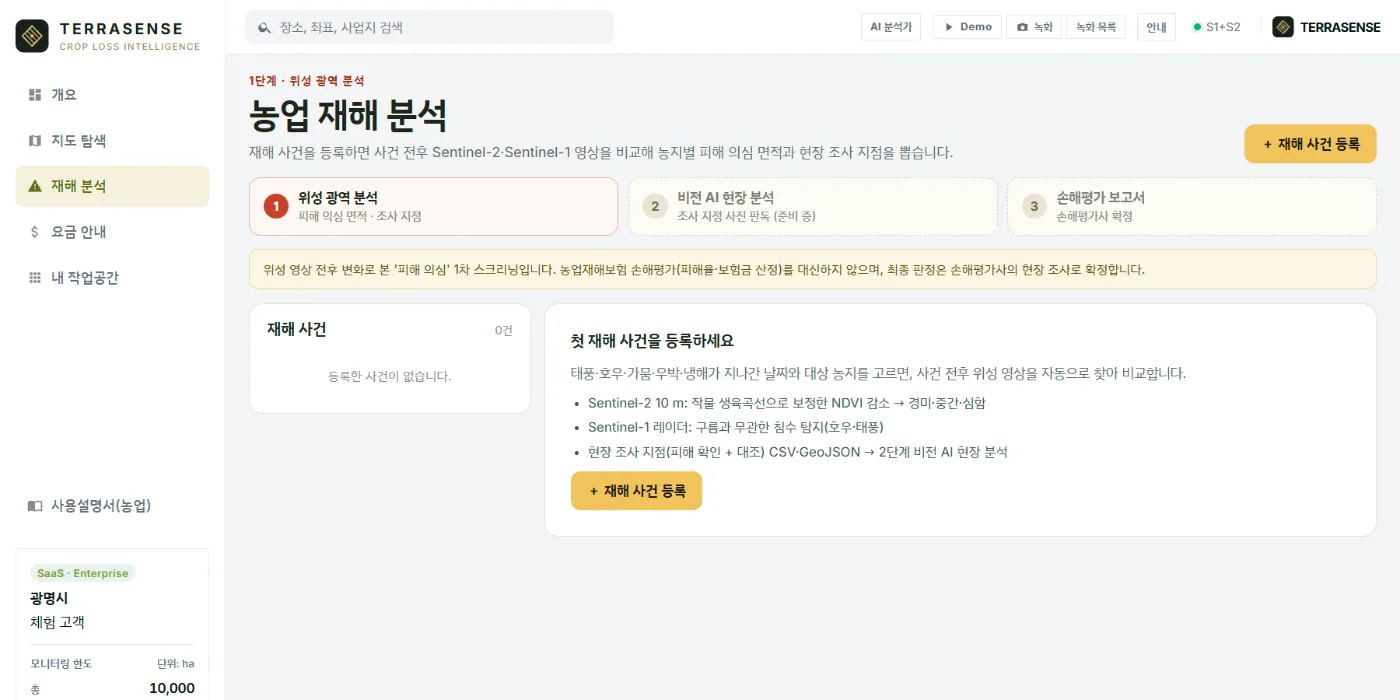
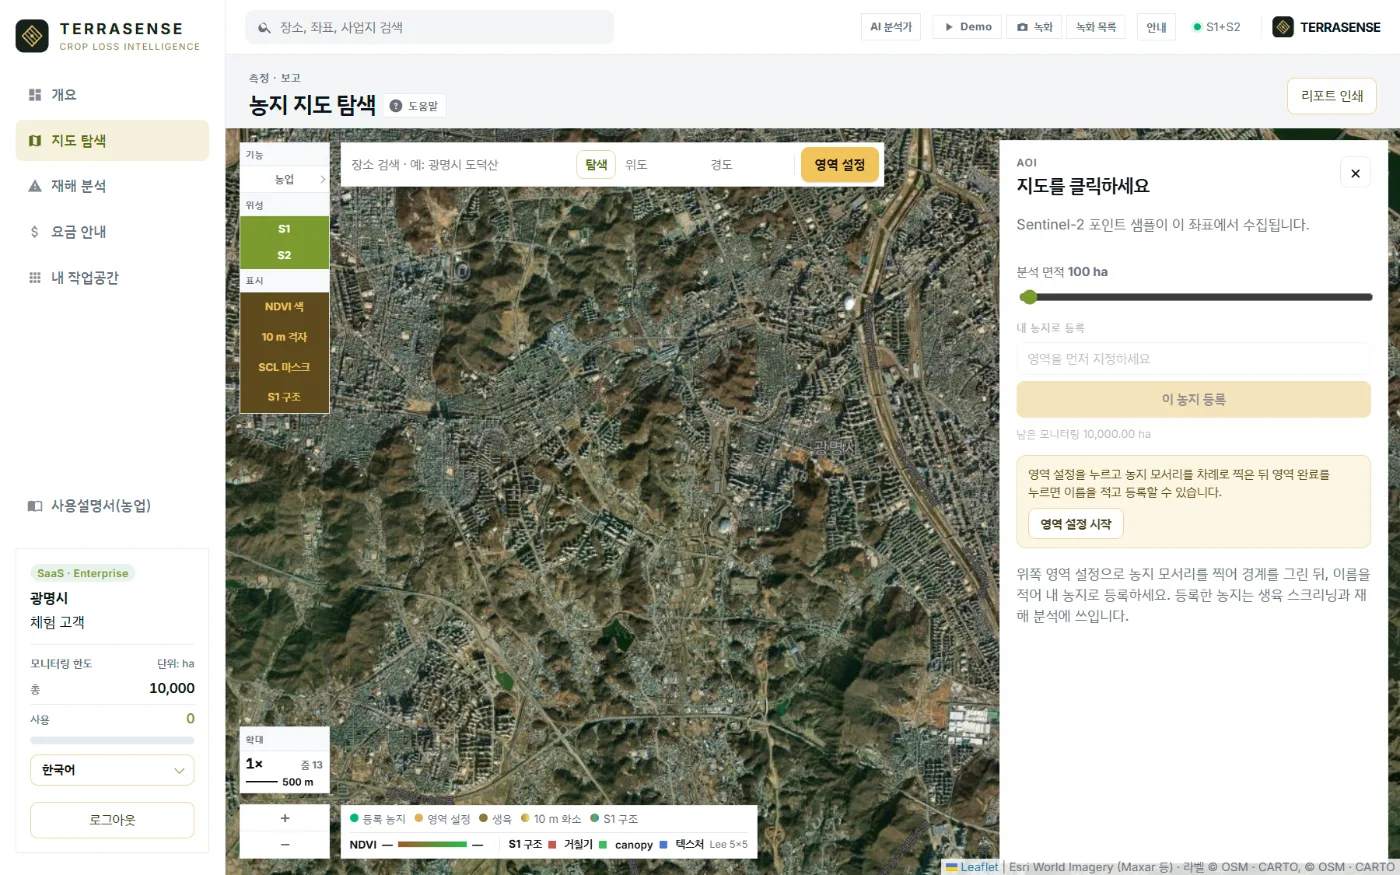
TERRASENSE opened with a demo account. It runs in a web browser and the interface switches between 17 languages.
How it works
From orbit to the loss report, in four steps.
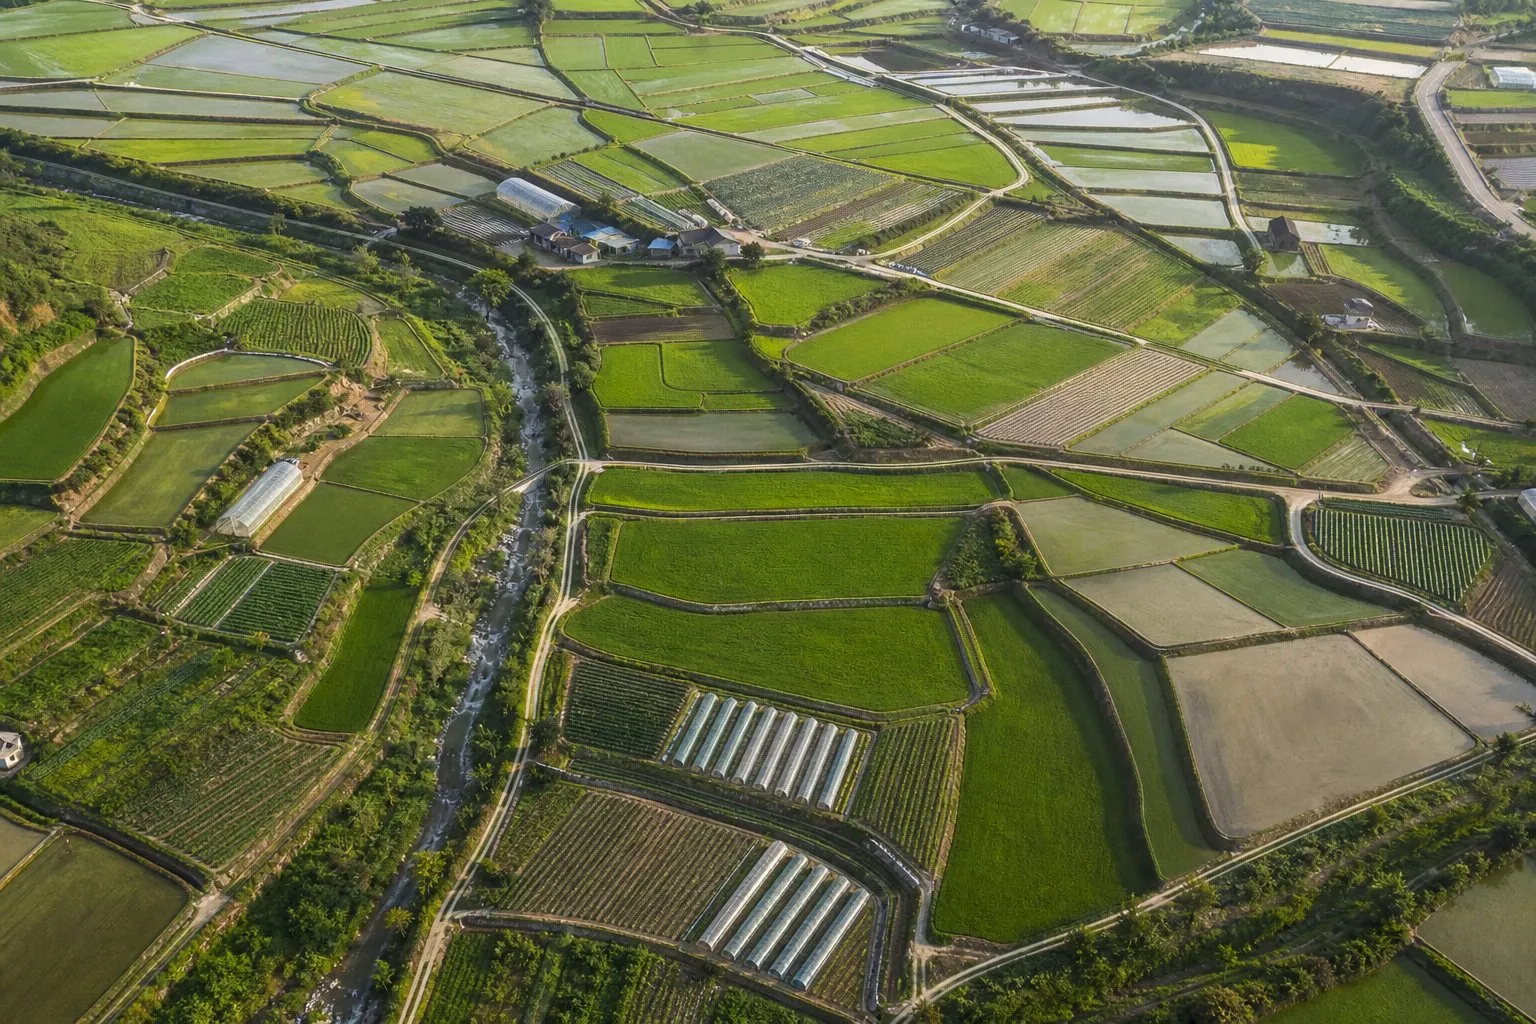
Register fields
Click the field corners on the map, name it and save. Parcel candidates can guide you.
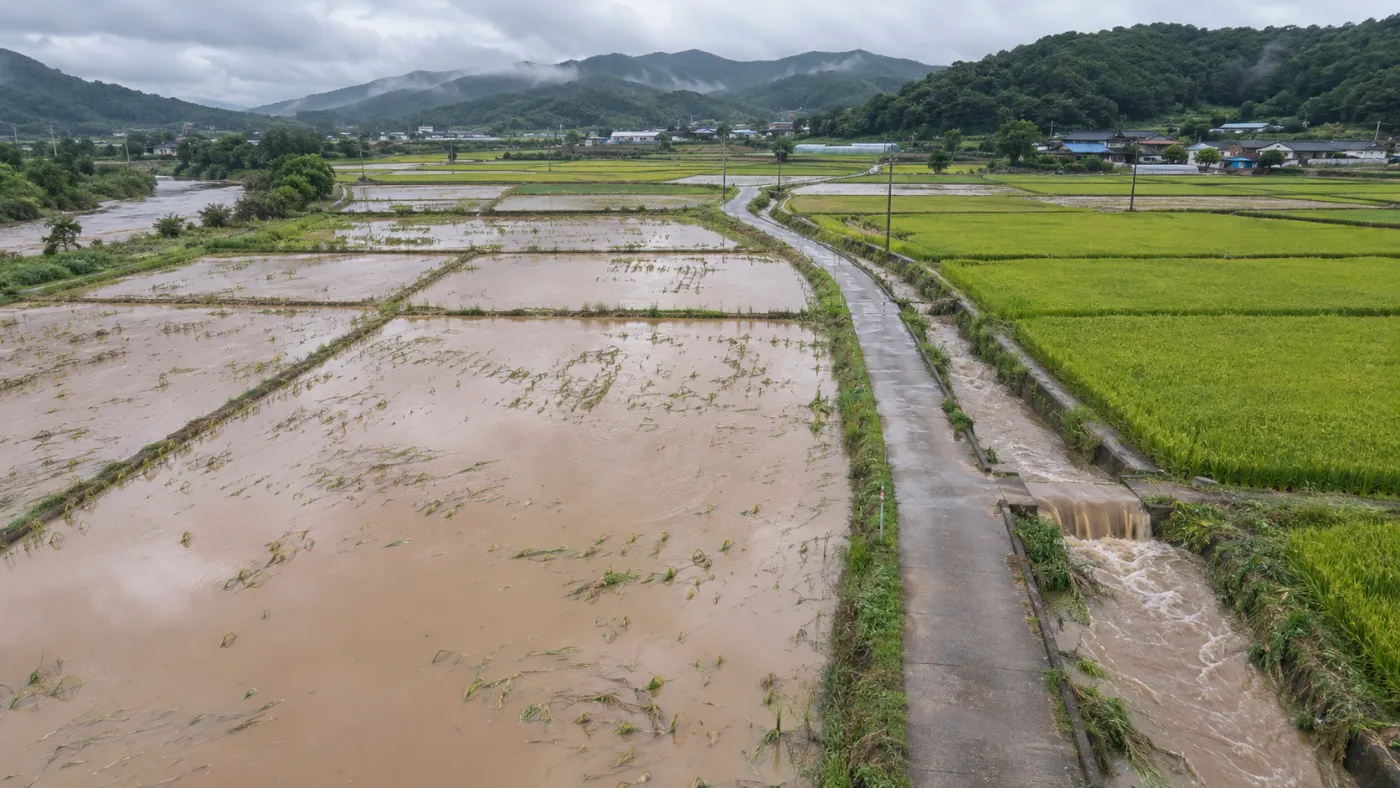
Register a disaster
Pick the date a typhoon, heavy rain, drought, hail or cold snap passed, and the fields affected.
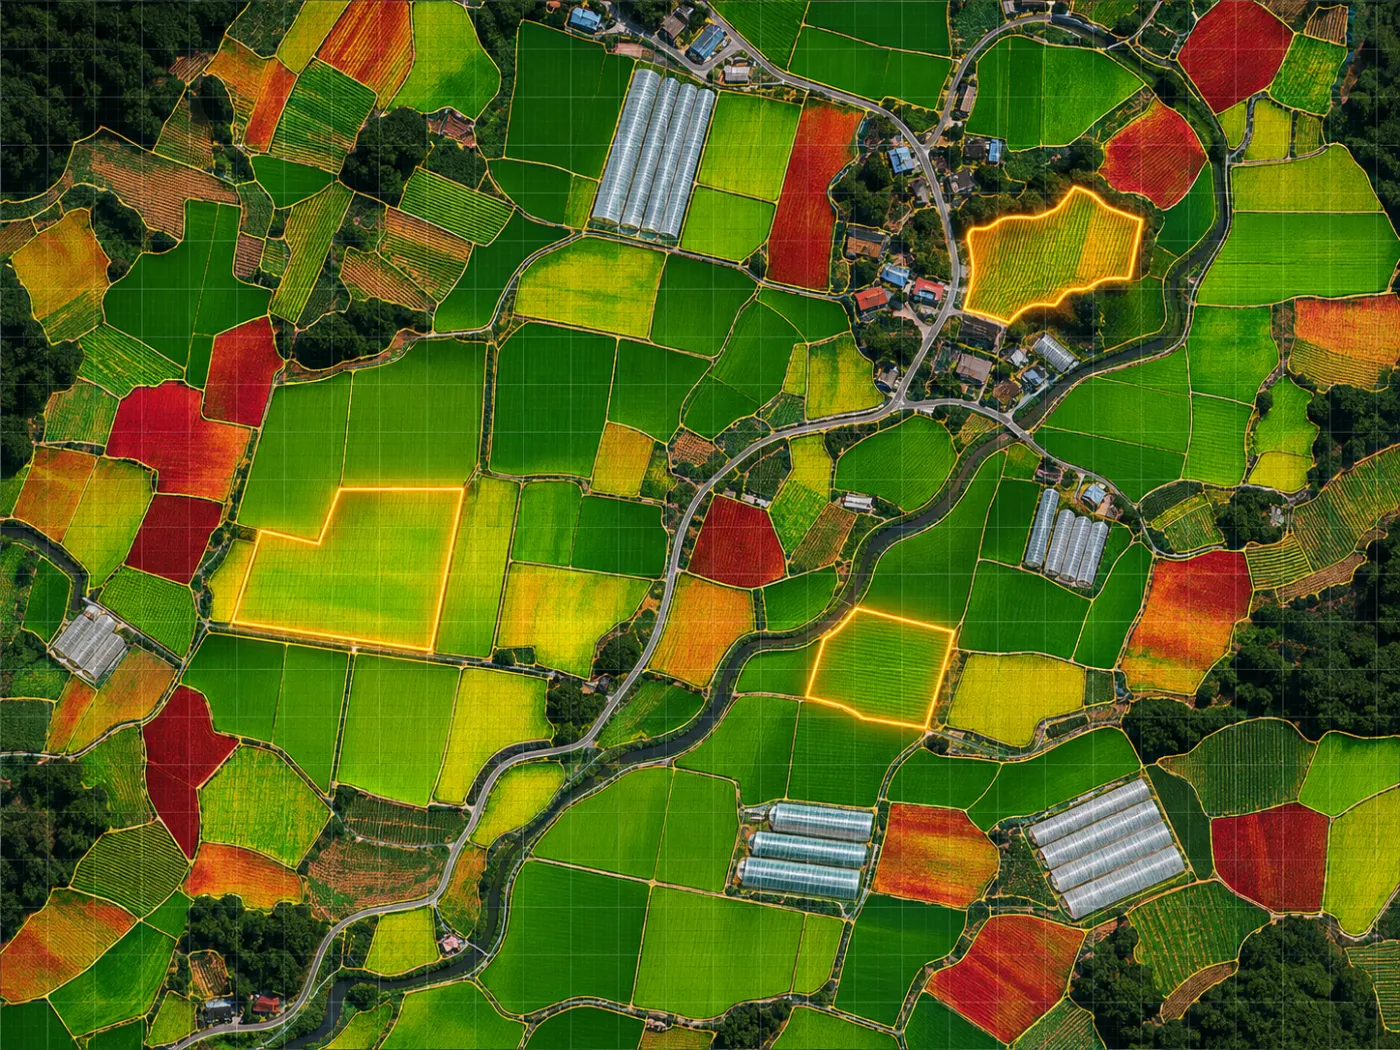
Before/after comparison
Clear scenes before and after are found automatically; damage grades and floods are computed per 10 m cell.
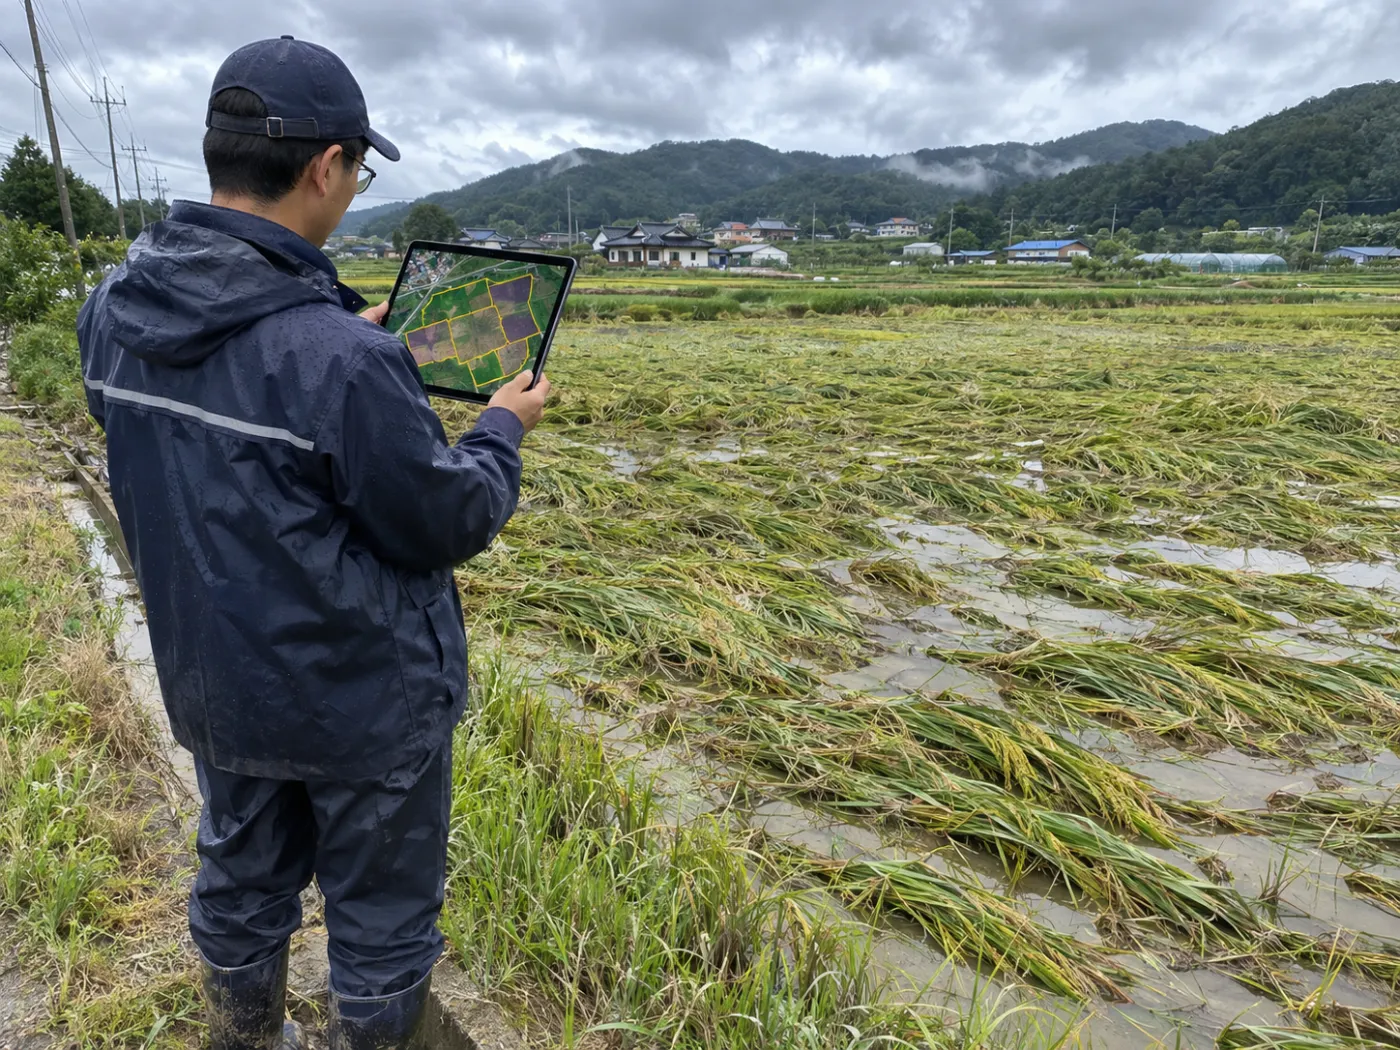
Survey points and report
Coordinates for 3 damage points and 1 control, a damage map and a draft report go to the field team.
Built on free public satellites and open data
How the calls are made
We publish what counts as “suspect”.
Every call is a first screening that decides what to check in the field. Crops are chosen by the user; the satellite does not classify them.
Disaster damage
Per-10 m NDVI loss between Sentinel-2 images before and after the event, graded minor, moderate or severe. Harvest-season decline is discounted; rain and typhoons also get Sentinel-1 flood detection.
Survey points
Up to three worst-hit points and one healthy control are passed to the stage-2 field survey as coordinates.
Water stress
Leaf moisture (NDMI) below the growing-season baseline. A candidate for drought, poor irrigation or heat damage.
Growth lag
NDVI below what is expected for the same crop at the same time. A candidate for flooding, lodging, pests or cold damage.
Rescreen due
Fields never screened or last screened more than 14 days ago. Cloudy scenes are skipped for the next clear one.
A person decides
Loss rate and indemnity are confirmed by a certified assessor in the field. TERRASENSE speeds up everything before that.
Who it is for
Built for the people who move first after a disaster.
One platform supports local government, crop insurers and loss adjusters, and farm cooperatives.
- County farm offices: narrow down damaged fields and order the checks
- Crop insurers and loss adjusters: survey points and maps to plan routes
- NongHyup and farm corporations: watch growth, compare at once
- By disaster type: typhoon, rain, drought, hail, cold
Why TERRASENSE
Not just imagery: an order to survey in, and the evidence.
Field surveys give an accurate verdict. TERRASENSE fills in where to look first and on what basis.
| Field survey only | Optical imagery only | TERRASENSE | |
|---|---|---|---|
| Coverage | Fields visited | Whole scene | All registered fields (10 m cells) |
| After a cloudy typhoon | Depends on access | Cloudy cells unusable | Cloud cells dropped; floods via radar |
| Before/after | Surveyor’s photos and memory | Done by hand | Automatic scene pick, seasonal correction |
| Survey order | Order of claims | None | 3 damage + 1 control coordinates |
| Output | Survey sheet | Image files | Damage map, area, share; PDF, CSV, GeoJSON |
| Final verdict | Certified assessor | n/a | Certified assessor (TERRASENSE screens first) |
General characteristics of each approach; they vary by organisation and product. See the full comparison
Pricing
A one-year subscription per county.
When disaster strikes, get damage-suspect area and survey points for a whole county’s farmland right away.
- Monitoring area 10,000 ha
- 240 growth screenings a year
- Disaster analysis · damage map · survey points
- Loss-assessment draft report (PDF)
Stage 1 · Satellite analysis
Disaster events, Sentinel-2 before/after, Sentinel-1 flood detection, 10 m damage map, survey points CSV/GeoJSON, report PDF.
Everyday · Growth screening
Paddy, upland and orchard stage, NDVI and NDMI, early water-stress and growth-lag warnings, degree-days and rainfall.
Stages 2–3 · Coming
Vision-AI field survey and the combined satellite + field draft report roll out during the pilot.
Who builds it
A team that runs AI in industrial sites.
TERRASENSE is built by MomentCube, an industrial AI company in Korea, combining field video and sensor AI with satellite data.
3 R&D projects led
Switchgear predictive maintenance, context-aware AI safety, NVIDIA collaboration.
3 registered patents
Industrial AI safety, autonomous equipment management, automatic reports.
Public sites in operation
AI fire watch and safety control at Incheon Environmental Corporation.
Certified venture
Innovation-growth type, in-house R&D department.
FAQ
Frequently asked questions
What is TERRASENSE?
TERRASENSE is a satellite + vision-AI service that supports crop disaster loss assessment, built by MomentCube. It compares satellite images before and after a disaster to find damage-suspect fields and survey points, and carries them through to a draft report for the certified loss assessor.
Does it replace the loss assessment?
No. It is a satellite first screening of suspected damage. The loss rate and indemnity are confirmed by a certified assessor in the field.
Which satellites does it use?
Optical Sentinel-2 (10 m) and radar Sentinel-1, both free from the European Copernicus programme. Weather comes from Open-Meteo.
What happens when it is cloudy?
Cloudy cells are dropped and the next clear scene is used. Floods after heavy rain or typhoons are found with Sentinel-1 radar, which sees through cloud.
Does the satellite identify the crop?
No. Paddy, upland or orchard is chosen by the user. The crop sets the base temperature (10, 5 or 7 °C) and the expected growth curve.
Do we install anything in the field?
No. It runs in a web browser. In the field, the only job left is taking photos at the survey points.
Insights
TERRASENSE blog
Crop loss assessment, and where satellite first screening fits in
Crop losses are confirmed in the field. Here is where a satellite first screening helps before that, deciding where to look first…
Reading typhoon crop damage with NDVI: how before/after comparison works, and its limits
How the NDVI vegetation index finds crop damage before and after a typhoon, the limits around harvest, cloud and small plots, and…
Finding flooded paddies with radar satellites, through monsoon and typhoon cloud
How Sentinel-1 radar finds flooded paddies through monsoon and typhoon cloud, how it differs from optical satellites, and how flood results lead…
Work with us
See your county’s fields from orbit, before the next storm.
We start with a satellite screening of your area from public data, then compare the results with your own field survey records. No equipment goes in the field.