Where to go first, as coordinates.
After the disaster analysis, TERRASENSE picks up to three of the worst-hit points and one healthy control in each field and hands them to the field survey.
Method
Three damage points, one control.
Looking only at the worst spots makes it hard to tell disaster from ground that was always poor. So a healthy point in the same field is picked as a control.
- Damage points D1–D3 plus healthy control C1
- CSV and GeoJSON for field apps and GIS
- Survey-point PDF
- Feeds the stage-2 vision-AI field survey (coming)
Example
How survey points are handed over.
Damage 1
Highest-graded cell
Damage 2
Second highest
Damage 3
Third highest
Control
Healthy cell, same field
Exported as CSV, GeoJSON and PDF. Lightly hit fields may get fewer than three damage points.
Stage 2 · Coming
AI reads the photos taken at the points.
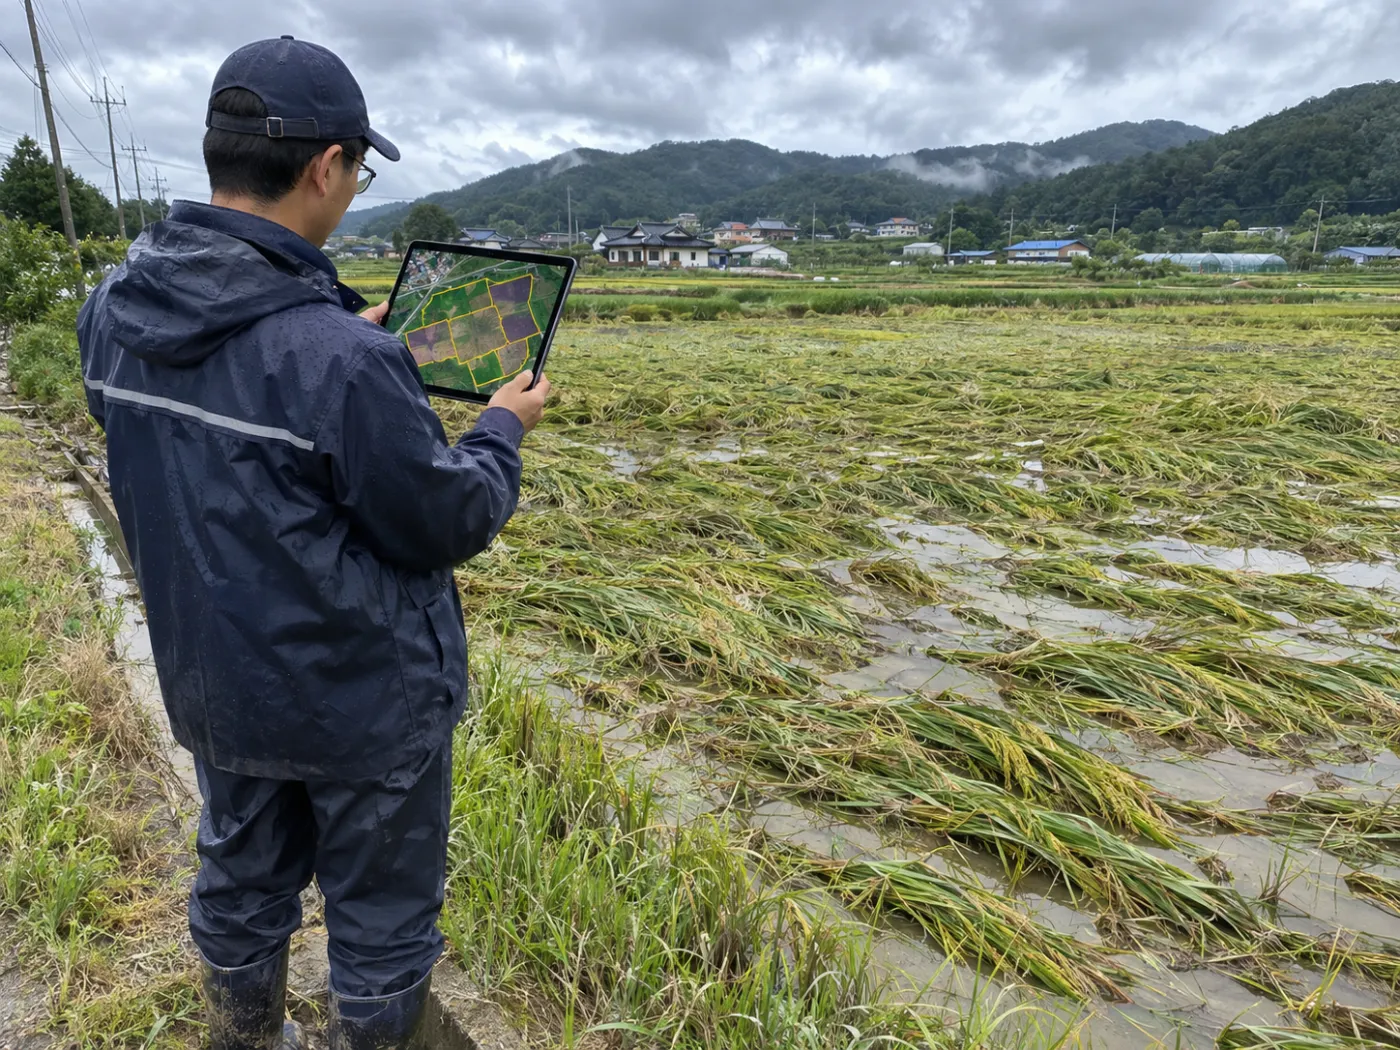
A vision-AI field survey that reads photos from the survey points for lodging, flooding and fruit drop rolls out during the pilot.
Lodging
Rice flattened by wind and rain, read from the photo.
Flooding
Waterlogging and muddy water, checked in the photo.
Fruit drop
Fallen fruit on the orchard floor, found in the photo.
Specification
Data, method and outputs
| Item | Detail |
|---|---|
| Damage points | Up to 3 worst-hit (D1–D3) |
| Control | 1 healthy (C1) |
| Formats | CSV · GeoJSON · PDF |
| Next step | Stage-2 vision-AI field survey (coming) |
TERRASENSE is a satellite first screening of suspected damage. It does not replace the crop-insurance loss assessment: the loss rate and indemnity are confirmed by a certified loss assessor in the field.
FAQ
Frequently asked questions
How many points per field?
Up to three of the worst-hit points and one healthy control.
Which files do we get?
CSV and GeoJSON, plus a PDF with the points marked.
When can photos be read by AI?
The stage-2 vision-AI field survey is in preparation and rolls out during the pilot.
Related pages
Work with us
See your county’s fields from orbit, before the next storm.
We start with a satellite screening of your area from public data, then compare the results with your own field survey records. No equipment goes in the field.