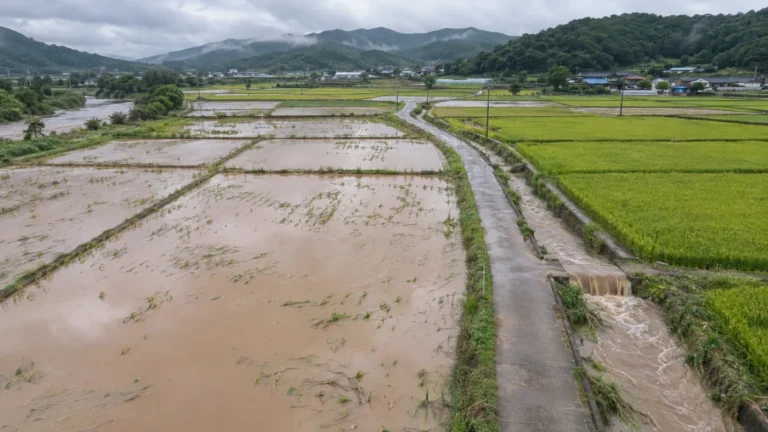
Reading typhoon crop damage with NDVI: how before/after comparison works, and its limits
To see typhoon crop damage widely from orbit, the first index to reach for is NDVI.
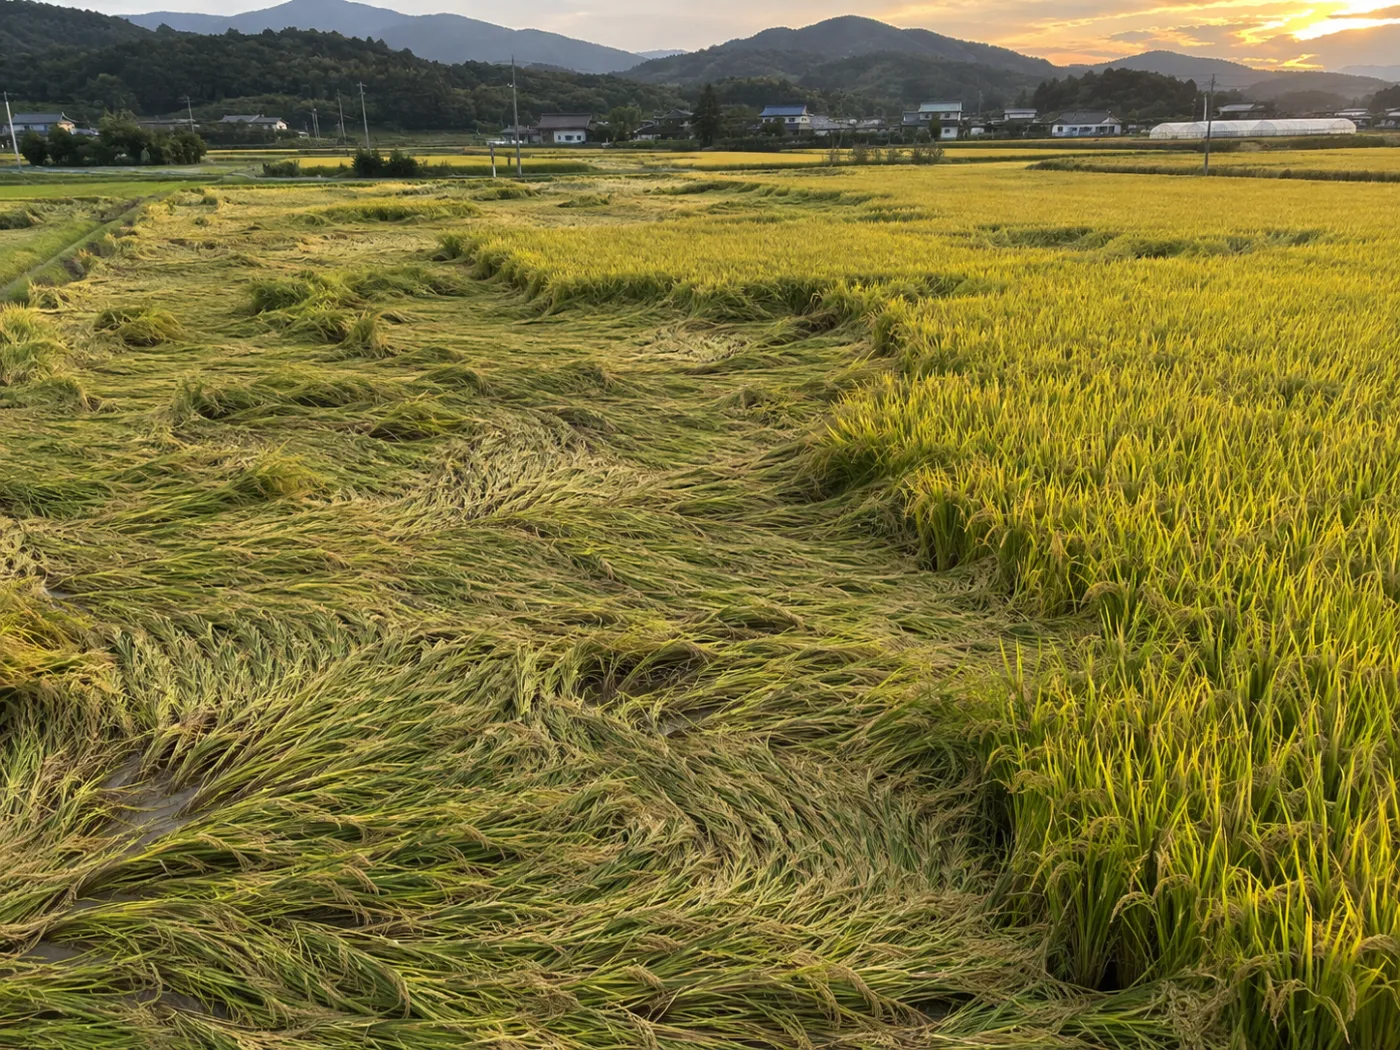
Healthy leaves absorb red light and strongly reflect near-infrared. When crops are flattened or leaves are damaged, that gap narrows. NDVI turns the gap into a number.
Category: Satellite analysis
NDVI reads greenness from red and near-infrared
NDVI is near-infrared minus red, divided by their sum. Higher means more, healthier leaves. NASA Earth Observatory explains the idea well. Sentinel-2 captures both bands at 10 m, so one paddy splits into several cells.
Before/after NDVI comparison
The closest clear scene before the event.
A clear scene after the event.
After minus before, cell by cell.
Corrected with the growth curve: minor, moderate, severe.
Cloud cells are dropped.
Not every NDVI drop is damage
NDVI rises as crops grow and falls as they ripen. A typhoon at harvest mixes normal decline with damage. TERRASENSE discounts the normal decline for that time of year using the crop growth curve. The crop itself (paddy, upland, orchard) is chosen by the user and sets the base temperature (10, 5 or 7 °C); the satellite does not classify it.
One typhoon, from orbit (example)
Clear Sentinel-2 scene
Event registered
Floods checked through cloud
First clear scene
3 damage + 1 control points
Cloud, small plots and forest edges need care
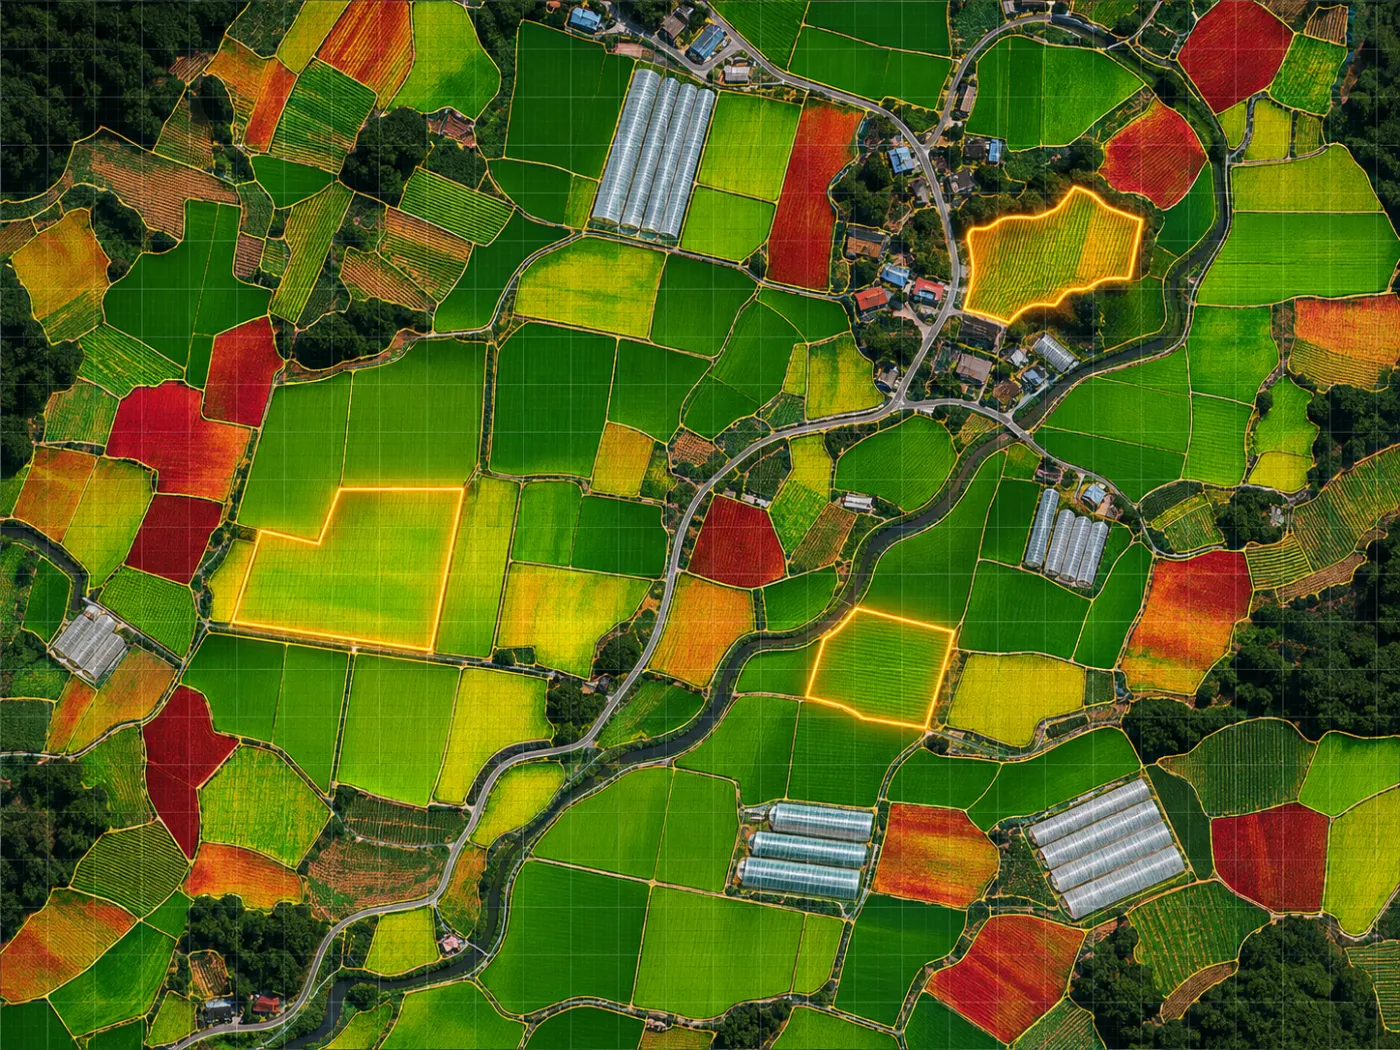
Cloud lingers after typhoons. Cloudy cells are skipped for the next clear scene while radar checks floods. The 10 m grid suits large paddy blocks and is weaker on small plots, and forest pixels at field edges can push NDVI up. That is why satellite results choose the survey points and the field makes the call.
TERRASENSE adds radar and survey points to NDVI
TERRASENSE pairs before and after scenes, grades ΔNDVI per cell, overlays Sentinel-1 flood cells for rain and typhoons, and summarises damage-suspect area, loss share, a 10 m damage map and survey coordinates. Everyday records come from growth screening.
Frequently asked questions
Is every NDVI drop damage?
No. Harvest decline, cloud and forest pixels all play a part. Growth-curve correction and field checks go together.
Can lodged rice be seen?
Wide lodging can show up as NDVI change, but whether rice lodged is confirmed with field photos.
How is NDMI different?
NDMI reads leaf moisture and is used for water stress such as drought, poor irrigation or heat.
Want to know which fields to check first after the next storm?
We start with a satellite screening of your county or portfolio and compare it with your own field survey records.
Request a demo →Edited and answered by the MomentCube TERRASENSE team / james@momentcube.com · +82-32-212-1011